Technical Analysis
Reading Candlestick Charts: Structure, Context and Common Illusions
Updated 2026-08-09 · 9 min read · 10,190 readers · By the NordicFX Research Hub research desk

The candlestick is a compact data container. Each one summarises four numbers over a fixed interval: open, high, low and close. Everything else that traders read into a chart is interpretation layered on those four numbers.
This guide covers what the format genuinely encodes and where interpretation starts to outrun the evidence.
Anatomy of a single candle
The body spans the open and close; the wicks reach the interval's extremes. A long body indicates directional conviction sustained through the period, while a small body with long wicks indicates that both directions were attempted and neither held.
Colour conventions are cosmetic. What matters is the relationship between the body and the wicks, and the position of the close within the range — a close near the high of the interval says something different from a close near the low, regardless of colour.
Timeframes change the story
The same price history looks bullish on one timeframe and bearish on another because each aggregates different intervals. This is not a contradiction; it reflects the fact that participants with different horizons are doing different things at the same moment.
A workable habit is to establish structure on a higher timeframe first, then move down for entry detail. Reversing that order produces the familiar experience of a perfect setup on the five-minute chart that dissolves against the daily trend.
Patterns that carry information — and the context they need
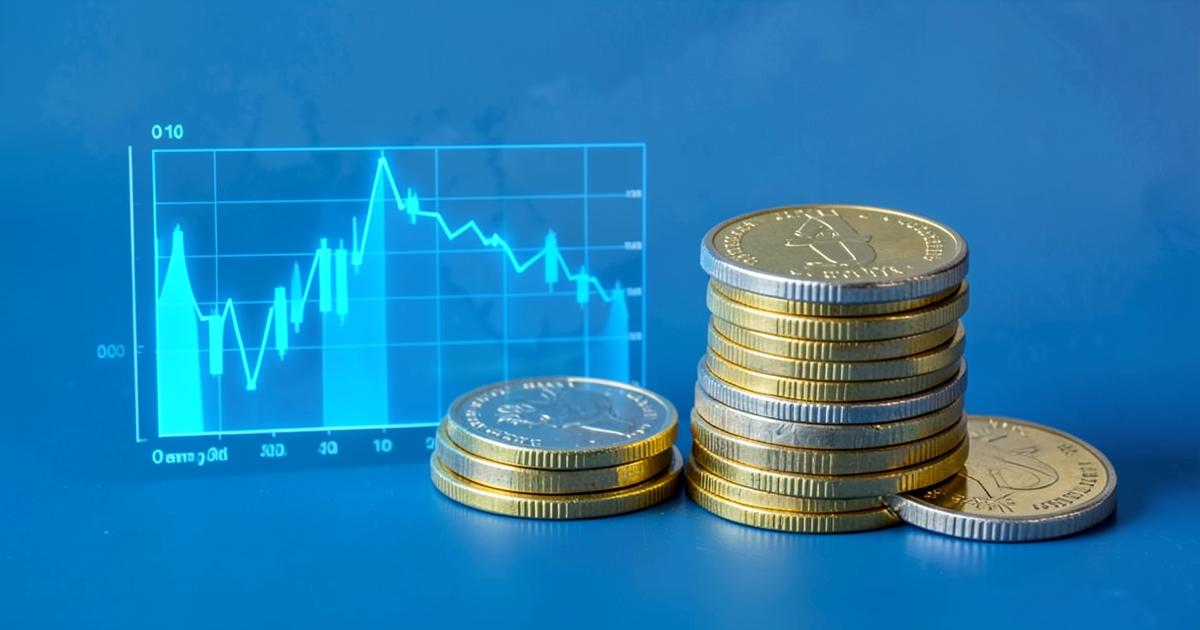
Engulfing candles, pin bars, insides bars and dojis are the vocabulary most courses teach. Each describes a specific balance between buyers and sellers within an interval, and each is close to meaningless without location.
A pin bar rejecting a level that has held three times previously is evidence. The identical candle in the middle of a directionless range is noise. The pattern is the smaller half of the signal; where it occurs is the larger half.
- Engulfing — one interval fully reverses the previous body's range
- Pin bar — a long wick rejecting a level, with a small body at the opposite end
- Inside bar — contraction inside the prior range, often preceding expansion
- Doji — open and close nearly equal, indicating unresolved balance
Volume, spread and the missing dimension
Spot forex has no centralised volume, so platforms display tick volume — the number of price updates — as a proxy. It is a reasonable activity indicator but not a measure of contracts traded, and it should be read as such.
Spread behaviour adds another dimension that most chart readers ignore. A breakout that occurs while spreads are widening tells a different story from one that occurs in liquid conditions, and only the second is comfortably tradable.
Where chart reading fits in a research process
Technical structure identifies where a decision becomes cheap: levels that provide a close invalidation point and therefore an efficient risk-to-reward profile. It does not predict, and treating it as prediction is the most common misuse.
When testing any charting environment, including the tools discussed in our platform reviews, check the accuracy of historical data, the availability of a reliable clock and the ability to export trade history for honest evaluation.
Key takeaways
- A candle encodes only four numbers; everything else is interpretation
- Location matters more than the pattern itself
- Forex tick volume is an activity proxy, not contract volume
- Costs must be deducted before any pattern edge is believed
Independent research note: this site is not affiliated with, endorsed by or operated by NordicFX. References to the platform published at nordic-fx.com are made for research and educational commentary only. We provide no trading services, accept no deposits and do not link to any trading account.
Keep reading